Recent
Hybrid GraphRAG: Revolutionizing AI Responses with Knowledge Graphs and Retrieval-Augmented Generation
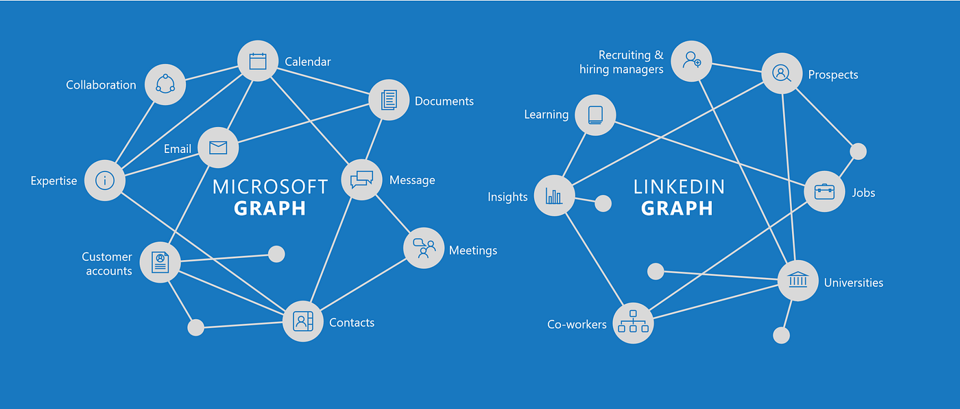
In the rapidly evolving fields of artificial intelligence and natural language processing, Retrieval-Augmented Generation (RAG) has emerged as a powerful paradigm. By combining the strengths of retrieval-based and generative models, RAG systems can leverage vast information repositories to generate highly relevant and contextually rich responses. However, as the complexity and volume of data grow, the need for more advanced techniques becomes clear. This is where knowledge graphs play a pivotal role.
read more
AIAvengers: Harnessing Multi-Agent Networks for Intelligent Automation in Review Responses and Data Analysis
AI Avengers is an innovative project that uses multi-agent networks to automate two main tasks. It improves response generation by using Crew AI to quickly and effectively reply to customer reviews, making interactions more personal and efficient. It also boosts data analysis by turning user questions into clear, visual insights with LangGraph, helping businesses understand their data better and make smarter decisions.
Response Generation: Streamlining customer review responses with Crew AI.
read more
Face Mask Detection - ResNet, OpenCV
Many measurements have been taken to tackle the COVID-19 pandemic. Among which, wearing a face mask is one way to prevent spreading the virus. This work aims to detect if a person is wearing a mask or not. With this objective, a machine learning model is developed, which leverages transfer learning to detect mask. For collecting human faces with the mask, a subset (1000 images) of the MAFA dataset is used.
read more
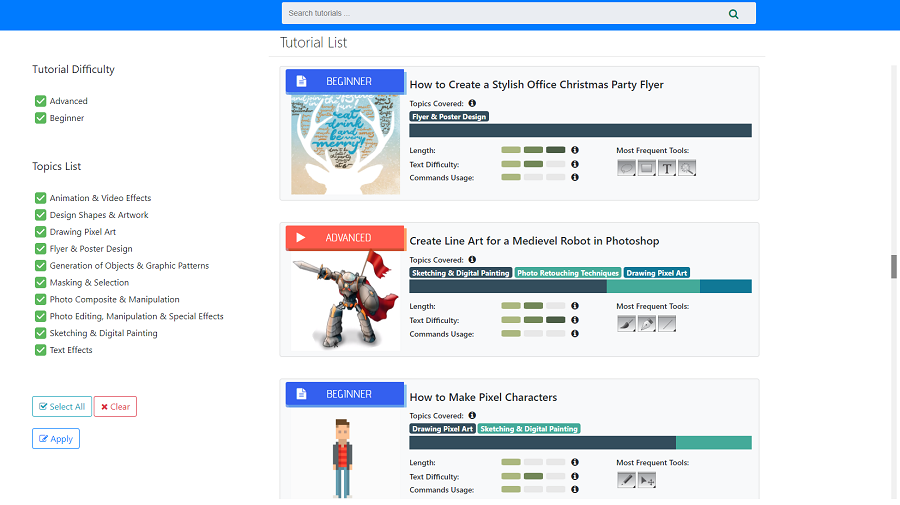
TutVis: A Tool to Visualize Tutorials - Topic Modeling(LDA), Random Forest, Angular js
Online text and video tutorials are among the most popular and heavily used resources for learning feature-rich software applications (e.g., Photoshop, Weka, AutoCAD, Fusion 360). However, when searching, users can find it difficult to assess whether a tutorial is designed for their level of expertise. TutVis stands for tutorial visualization, which is a Photoshop tutorial browsing system that provides auto-generated information to assist users in the tutorial searching and selection. The provided information is as follows: difficulty level (advanced/beginner), topics covered, length, text complexity, command usage ratio.
read more
Automatic Topic Extraction from Documents - LDA, Top2Vec
The objective is to develop an automated tool, which can find out topics from any article. Different topic modeling techniques are investigated for this topic extraction task. For the investigation, yahoo answer dataset has been chosen. The dataset has ~1.5M question-answer pairs. Only 60,000 samples has been randomly chosen from the data. From the selected data, only the answers are used to train the models. The models are trained using LDA and Top2Vec.
read more
Sentiment Analysis from Health and Fitness app reviews - BERT
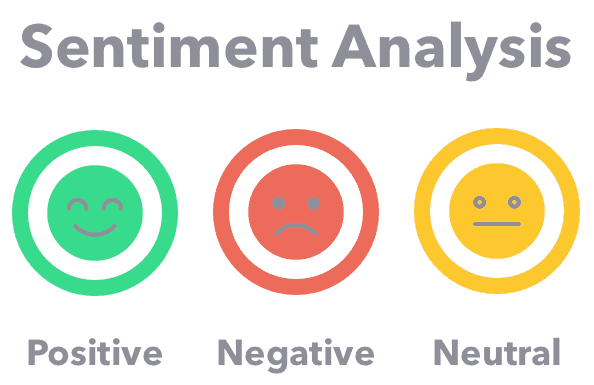
The objective of this project is sentiment analysis (i.e., Positive, Neutral, Negative) from the popular health and fitness app reviews. For this task, app reviews are collected from the google play store. 10 popular health and fitness apps are chosen. All around 12000 most recent reviews are collected. Ratings are considered as the measure/label of positive, negative, and neutral sentiment of the reviews. The collected data are preprocessed and trained using a transformer model.
read more
License Number Extraction - YOLO v4, Vision API (GCP)
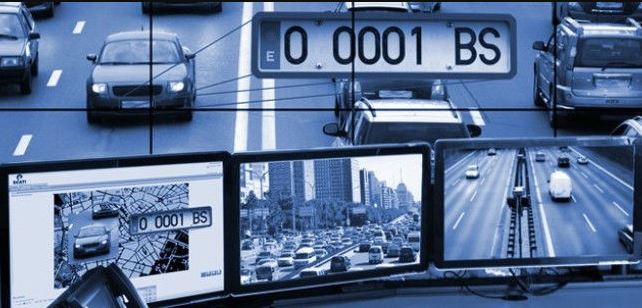
The objective is to extract the registration/license plate number from different vehicle images. The task is divided into two parts. First, detect the possible ROI(region of interest) - in this case, it is the license plate of vehicles. Second, extract the letters and numbers from the detected region. To separate ROI from the images, object detection model - YOLO v4 is used. YOLO v4 (You only look once) is a family of one-stage object detectors that are fast (i.
read more
PhenomDetect: Detection of Air Hazards in the U. S.- SVM, Random Forest, Gradient Boost, XGBoost, KNN, LSTM, GRU, Tableau
This project is a team effort of Team ‘Vesper’ participated in the NASA International Space Apps Challenge'20. Our team took on the challenge of the automatic air hazard detection because we were inspired by the idea of building a tool that could potentially save many lives just by automatically analyzing data from a variety of sources and putting this analysis into the hands of key decision-makers, as well as the general public.
read more
Credit Card Fraud Detection - Autoencoder, KNN, SVM, MLP
The purpose of this project is to leverage machine learning and find out fraudulent transactions of the credit cards. The idea is to prevent fraudulent activity only by analyzing credit card transaction data. The transaction data that has been used is highly imbalanced, having only 0.2% fraud cases. The overall challenge is to make a supervised model that can detect fraud transactions from normal transactions. The data can be found in the following link:
read more
Hotel Review Sentiment Analysis - Tf-Idf, Logistic Regression, RoBERTa
This project aims to classify ratings of the hotel reviews. There are 5 ratings (i.e., class) in the dataset along with the reviews. The dataset is quite balanced among the 5 classes. The objective is to develop two different classification models i.e., a baseline and a state of the art(SOTA) model to compare the performance of classifying ratings. To uncover interesting insights from the data, different exploratory analysis have been performed.
read more
Movie Recommender - K Means
The objective is to develop a simple movie recommender model that leverages user-ratings to recommend unseen movies to the users. Based on the movie-rating patterns of users, different clusters are formed. Each cluster groups together users with similar movie choices and ratings. This knowledge is later used to provide personalized movie recommendations. The data is collected from MovieLens dataset (small), which contains 100,000 ratings of 9000 movies (rated by 600 users).
read more
Customer Loan Enquiry - ANN, Django
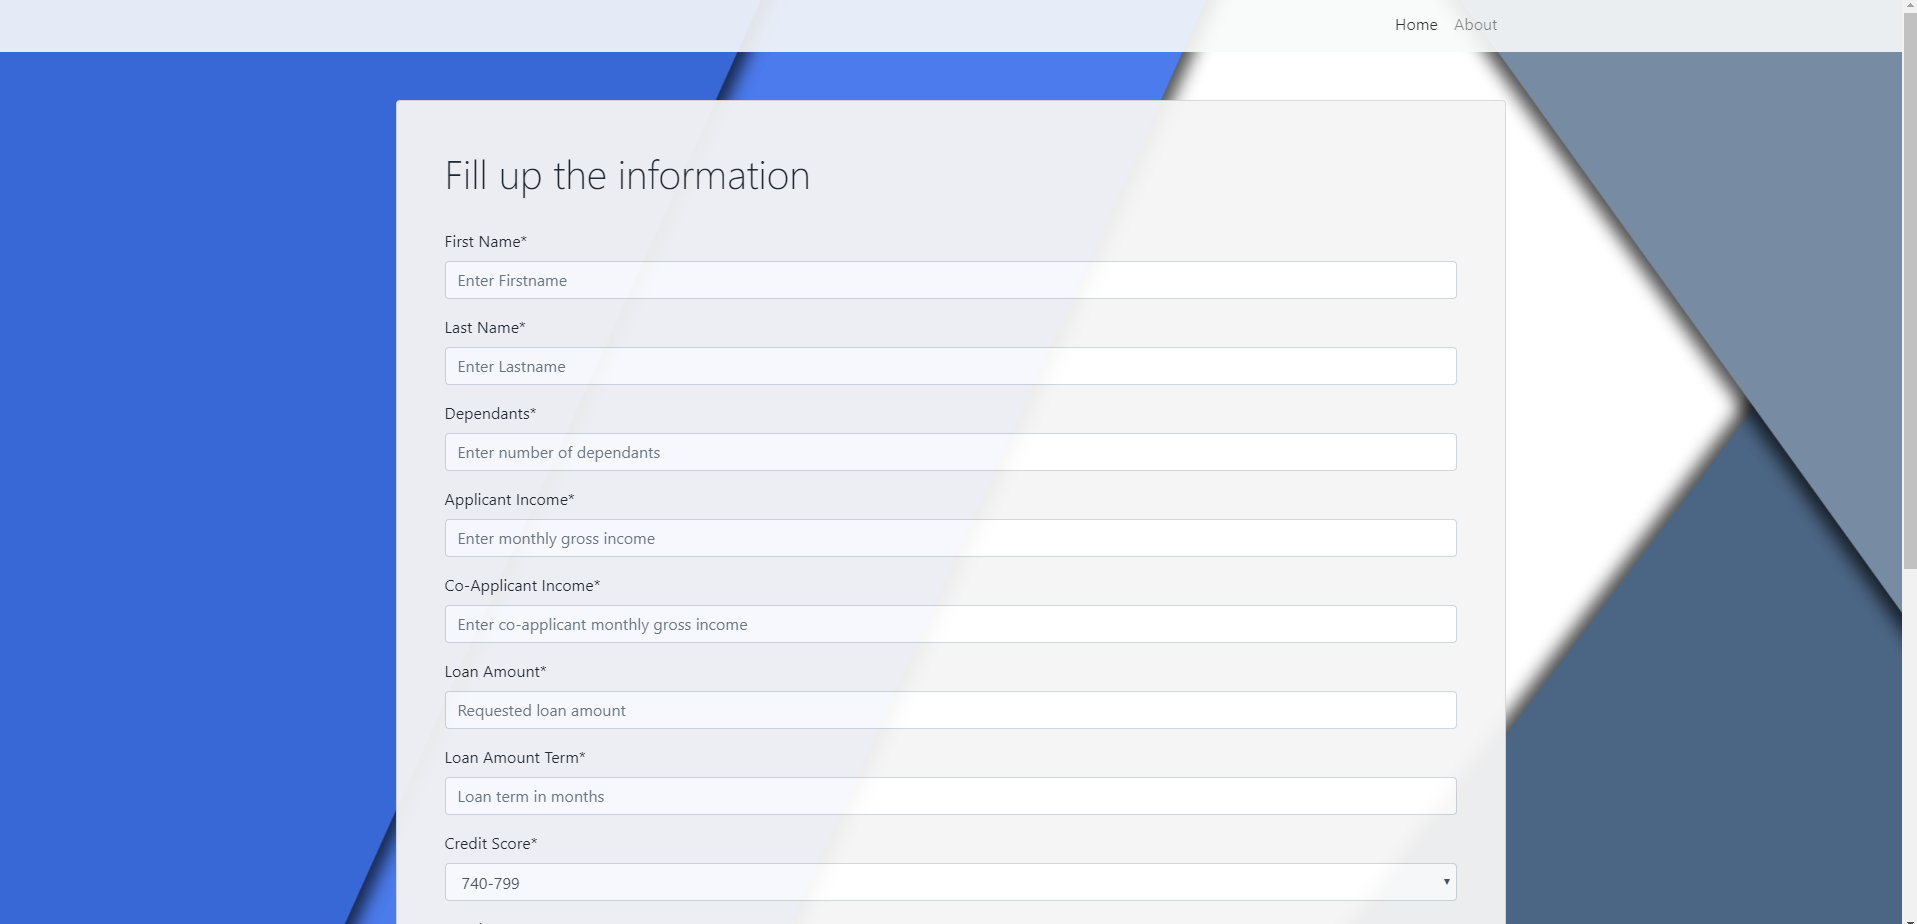
The objective of this project is to predict if a customer will get a loan given applicant income, loan amount, loan amount term, credit history, education status, self-employment status, property area, etc. A model is trained using the training data on previous customers’ loan approval history. A web service is created, which runs the trained model in the background. The service presents an interface through which any user can request to get an automated decision/prediction (i.
read more
Refining Word Embeddings - Word2Vec, Glove, FastText, LexVec
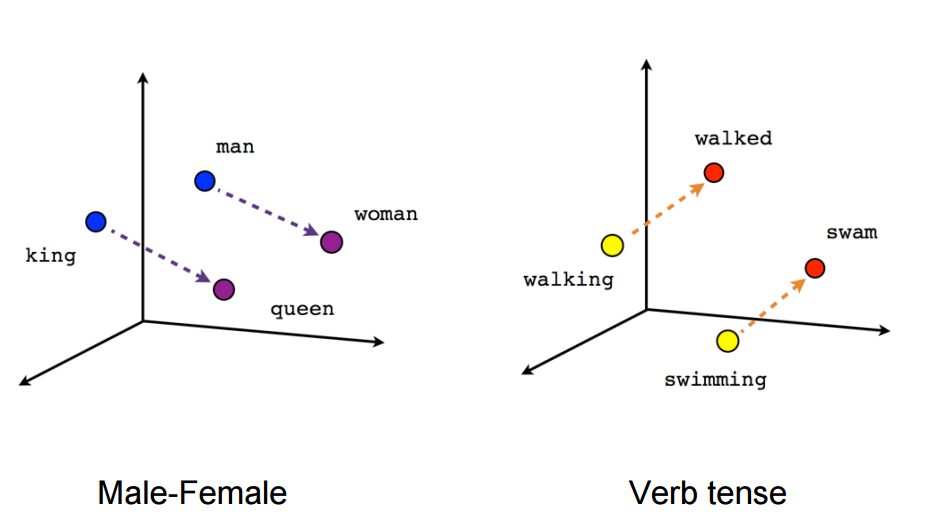
The objective is to implement different word embeddings and investigate the performance on a dataset. For this task, the chosen dataset includes tweets about disasters, e.g., earthquake, wildfire. Among the tweets, some are fake and some are real. So, there are two labels such as 1:Real tweet and 0: Fake tweet. This data has been chosen so that we can see if the features extracted using different embedding techniques can retain distinguishable information to detect which tweet is fake and which one is real.
read more
Question Classification - SVM, Logistic Regression, LSTM, BERT, Doc2Vec, TF-IDF
The objective is to build a question classification model. The questions have six different categories such as: Description(DESC), Entity(ENTY), Abbreviation(ABBR), Human(HUM), Location(LOC), Numeric Value(NUM).
To investigate different approaches, the following data is used (downloaded from https://cogcomp.seas.upenn.edu/Data/QA/QC/):
Training set 5(5500 labeled questions) Test set: TREC 10 questions
Different data analyses have been performed and four different models are trained. The models are the followings:
Tf-Idf + SVM: Tf-Idf is used for vectorizing texts and a linear model (i.
read more
Heart Disease Prediction - Classification, Flask, Streamlit, Docker, Feature Selection
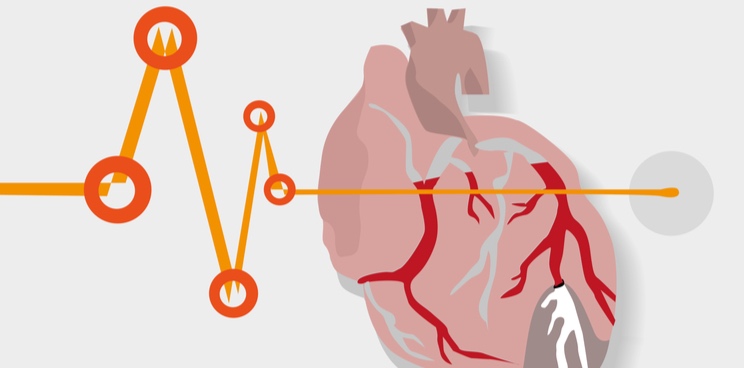
Heart disease or Cardiovascular disease is one of the biggest causes of mortality (i.e., causing 1 out of 4 deaths in the US) among the population of the world. Therefore, prediction of Cardiovascular disease is considered one of the important subjects in clinical data analysis. However, several contributory risk factors such as diabetes, high blood pressure, high cholesterol, abnormal pulse rate, etc. lead to cardiac arrest. So, the purpose of this work is to predict if any patient has the chance of having heart disease or not.
read more
Analysis of Parkinson Patient - Feature Selection, Classification
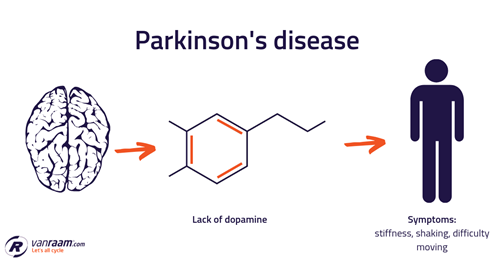
The objective is to detect patients with Parkinson’s Disease (PD) from the voice samples. The training data includes voice measurements such as average, maximum, and minimum vocal fundamental frequency, several measures of variation in fundamental frequency, variation in amplitudes, ratio of noise to tonal components, signal fractal scaling exponent and nonlinear measures of fundamental frequency variation. From these measurements, feature-selection (filter and wrapper method) is performed to select essential features for detecting Parkinson.
read more
News Classification - LSTM
The objective of this project is to classify news category from articles. The input data consist of 2225 news articles from the BBC news website corresponding to stories in 5 topical areas (e.g., business, entertainment, politics, sport, tech). LSTM has been applied in the classification task to categorize articles. TensorFlow 2.0 has been used to train the model. Word embedding is used in feature generation. TSNE is used to visualize the word vectors in 2d space.
read more
Earthquake Prediction Dashboard - Spark, Tableau, MongoDB
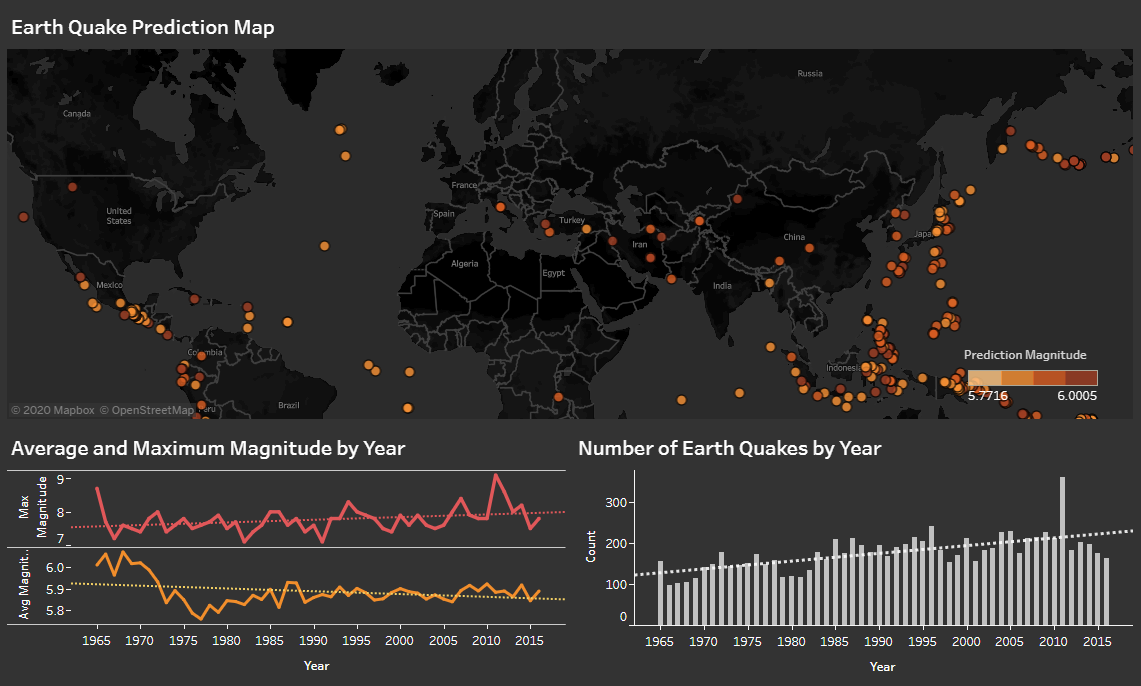
The objective is to report the prediction of the earthquake from the historical data. A machine learning model is trained with historical data of the world related to earthquakes from 1965-2016. The data includes geographical location and magnitude of the earthquakes (23.5k samples). The model predicts earthquake magnitude for the year of 2017. Finally, a dashboard is created to visualize the prediction in addition to the historical analysis on the data.
read more
Fake or Real Tweets - BERT, LSTM, TF-IDF
The dataset includes tweets about disasters, e.g., earthquake, wildfire. The objective is to detect if the tweet is about a real disaster vs. fake disaster. Different approaches have been performed for data cleaning and training the model. The best model can predict real vs. fake tweets with 89% accuracy using transfer learning (BERT).
The following models have been developed for training: BOW Model with Logistic Regression. (accuracy 77%) Tf-Idf with Logistic Regression.
read more
Weather Prediction - Bidirectional LSTM
This project predicts weather (i.e., min-max temperature) from historical data. The dataset includes hourly inputs of pressure, humidity, temperature, wind speed, and wind direction of 36 cities from the year 2012 to 2017. From the dataset preprocessing is done to engineer attributes to predict min and max temperature of Toronto. Data from 2012-2016 is used as the training dataset, while the attempt is to predict the min and max temp of 2017.
read more
Forecast Energy Consumption - ARIMA, PROPHET, LSTM
Forecasting energy consumption can be crucial to have a sense of how much energy/power needs to be produced. The objective of this work is to predict future monthly energy consumption from time-series data. The data includes hourly energy consumption of different states in the US collected by a regional transmission organization - PJM. Different exploratory data analysis are performed on the data to detect the daily, weekly, monthly, and yearly trends.
read more
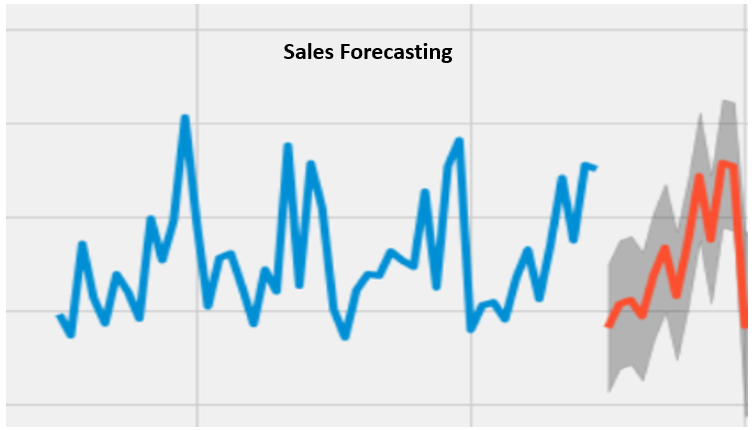
Price Forecasting - Facebook Prophet
The objective of this project is to forecast the future price of Avocado. The data presents a time series of the average Avocado price of different regions in the US over 4 years timeline. The data from the years 2015-2017 have been used to forecast the average price of Avocado in 2018. Different exploratory data analysis (EDA) has been performed to gain insights from the data.
EDA included: analyzing distributions (violin plot), regions affecting price hike (box plot), and trends (line plot).
read more
Stroke Prediction - Spark, MLib
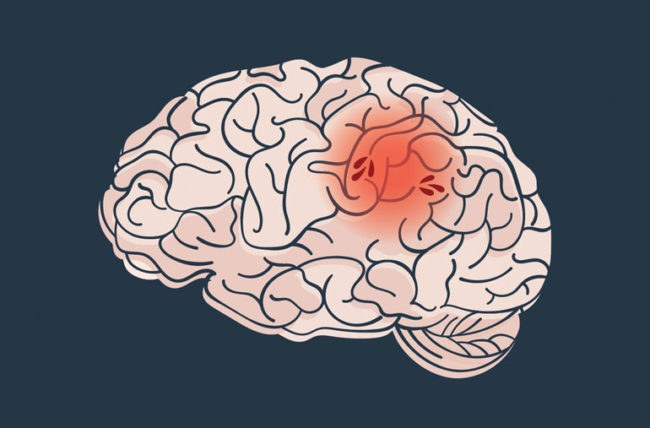
The objective is to predict brain stroke from patient’s records such as age, bmi score, heart problem, hypertension and smoking practice. The dataset includes 100k patient records. Among the records, 1.5% of them are related to stroke patients and the remaining 98.5% of them are related to non-stroke patients. Therefore, the data is extremely imbalanced.
The dataset is collected from https://bigml.com/dashboard/dataset/5e92c6d14f6bfd2dd00044a9
Dataproc and Google Cloud Platform is used to set up spark clusters.
read more
Predicting Food Preparation Time (SkipTheDishes) - Doc2Vec
The objective is to predict food preparation time from ordered food items and quantity. This is a data challenge arranged by SkipTheDishes, Canada’s leading and largest food delivery company. The data includes upto 10 ordered food items along with the quantity. There are 20 features and 80,000 samples in the data. The goal is to predict food preparation time.
Doc2Vec has been applied to vectorize food item names and feature engineering.
read more
Fish Telemetry Data Analysis - R
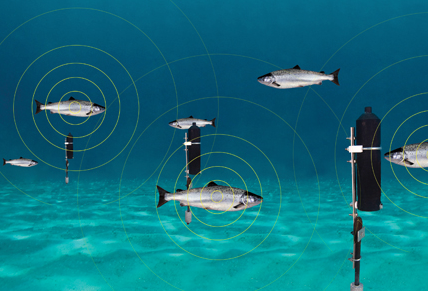
A small subset of the Lake Winnipeg telemetry data is collected. The purpose is to analyze this data to find out interesting insights about the fish inhabitants. A few highlights are as follows: the distribution of different species, the certain area where specific species can be found, and the time period of their perambulation. The data has the following attributes:
Date - A timestamp for when a receiver (station) detects a transmitter detection Name - A unique station name for each receiver in the study ReceiverLong - The longitude of the receiver ReceiverLat - The latitude of the receiver FishID - A unique identifier for each species tagged in the study Species - Species of the tagged fish This Project’s GitHub Repository
read more
COVID 19 USA Dashboard - Tableau
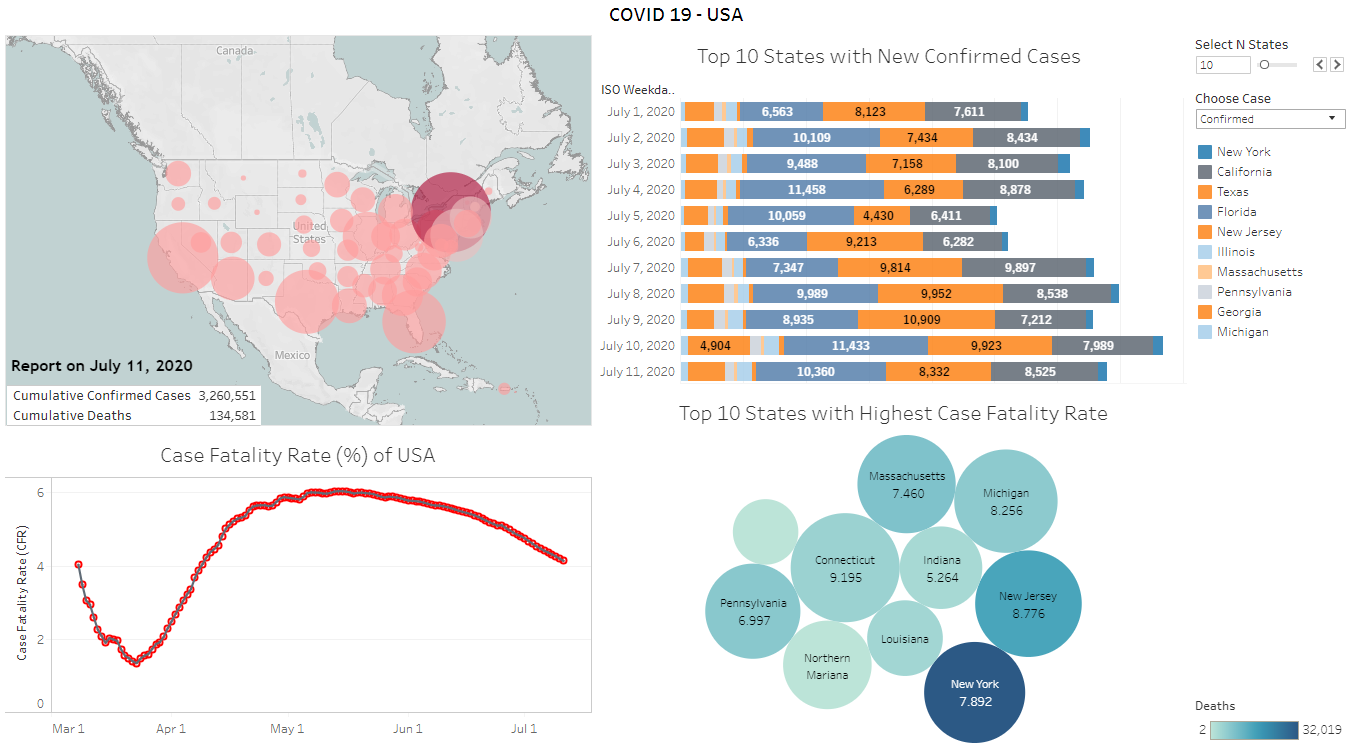
An interactive visualization dashboard including different states’ (of USA) confirmed cases and the number of deaths. The visualization presents different calculations such as top N states (i.e., N can be changed from the dashboard) with total confirmed cases and deaths, new cases and deaths; case fatality rates (CFR) on time series data collected from https://github.com/nytimes/covid-19-data. The interactive dashboard is created using Tableau Desktop. Different pie charts, maps, line charts, and stack bars are used in this visualization.
read more
COVID 19 World Visualization Dashboard - Tableau
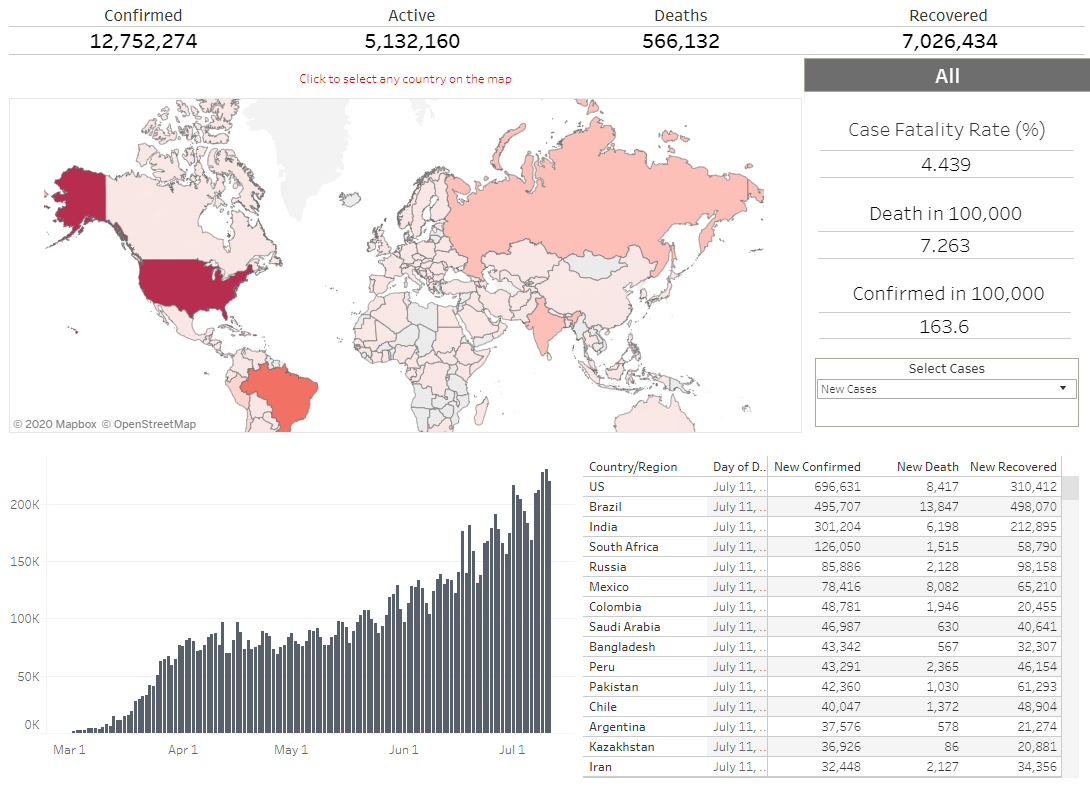
The dashboard presents an interactive visualization of the latest COVID-19 updates. It includes the trend line of the time series data, geographic map, cumulative & newly confirmed, active, death, and recovered cases. It also presents a calculation on Case Fatality Rate (CFR), confirmed & death cases in 100,000. The regular update is taken from https://github.com/datasets/covid-19. Data is preprocessed using Tableau prep builder. Tableau is used for the visualization. In this visualization, users can drill down to the country to see region-specific details (new cases and trends) and also overall comparisons among different regions.
read more
Web Dashboard on Canadian Wheat Production - Tableau, D3 js, Chart js, Angular js
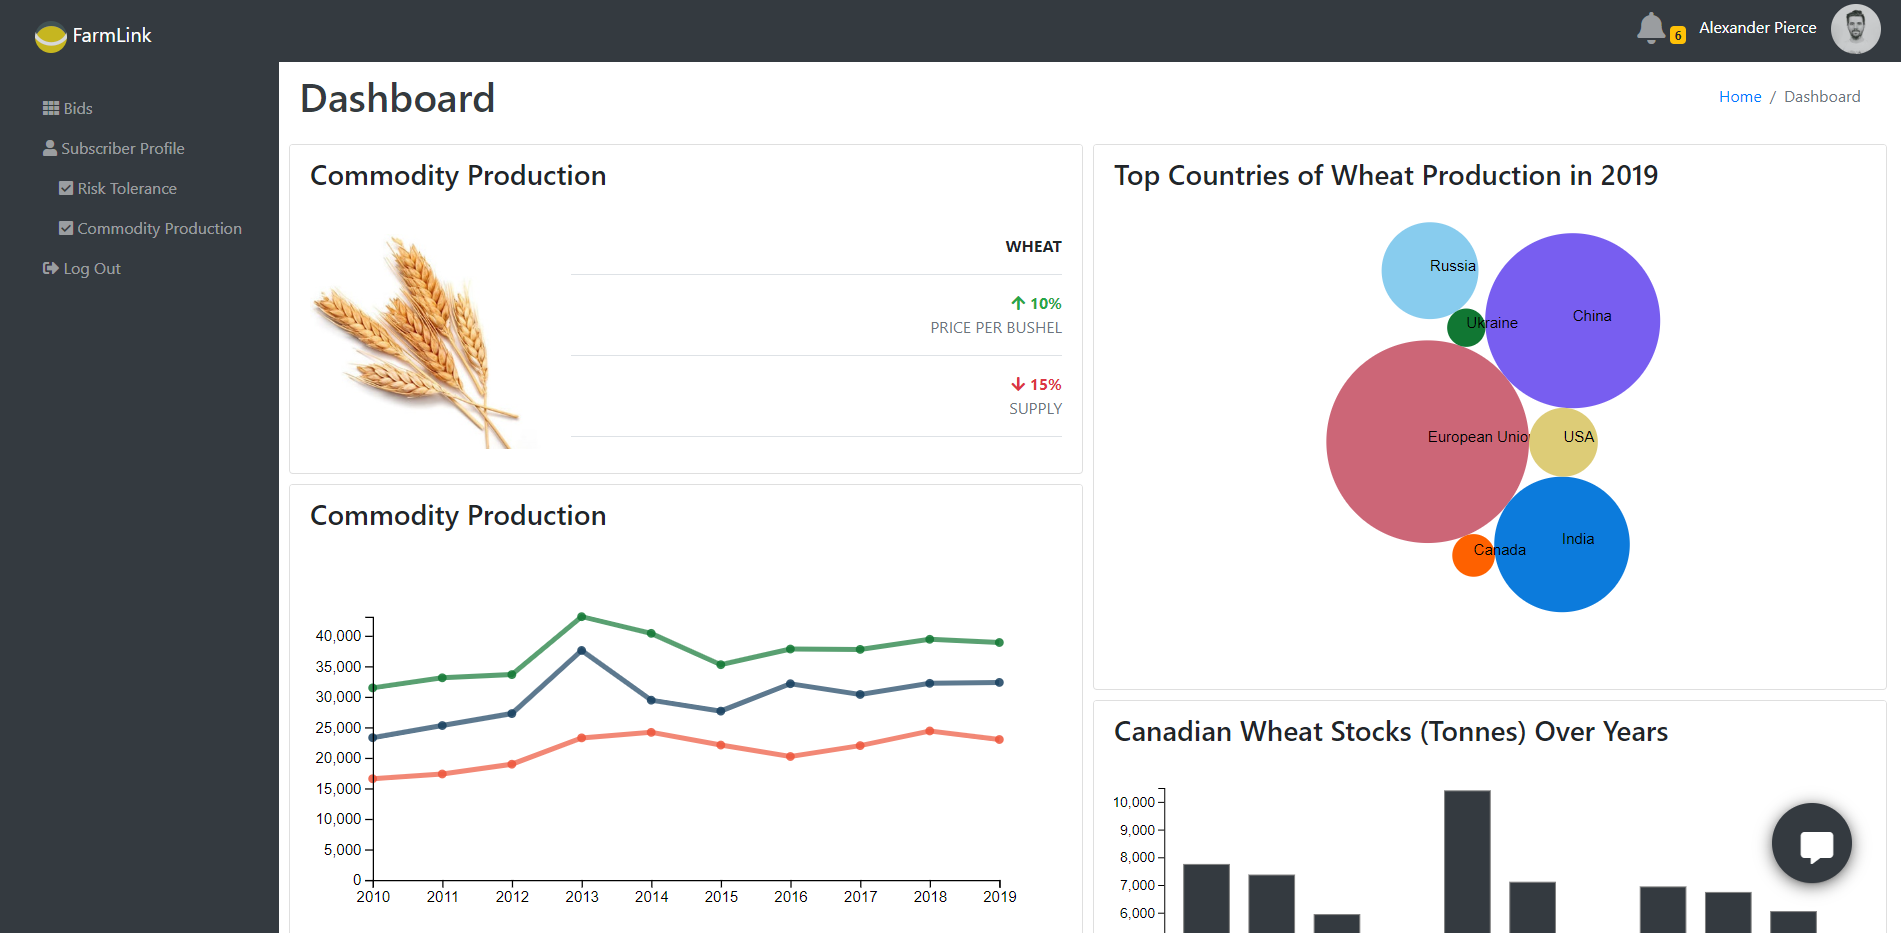
The purpose of this project is to gain insights into the agricultural market data of different commodities, e.g., Wheat, Corn, Barley, Oats etc. and present them in a dashboard. The data includes different attributes such as consumption, production, import, export, stocks, yield of the commodities. The data reports attributes on 125 countries and over 20 years timeline.
The UI supports responsive layouts. For developing the visualizations, PSD Grain Data_small.
read more
DynamicViz: Change data in real time. - Tableau, Django, REST API
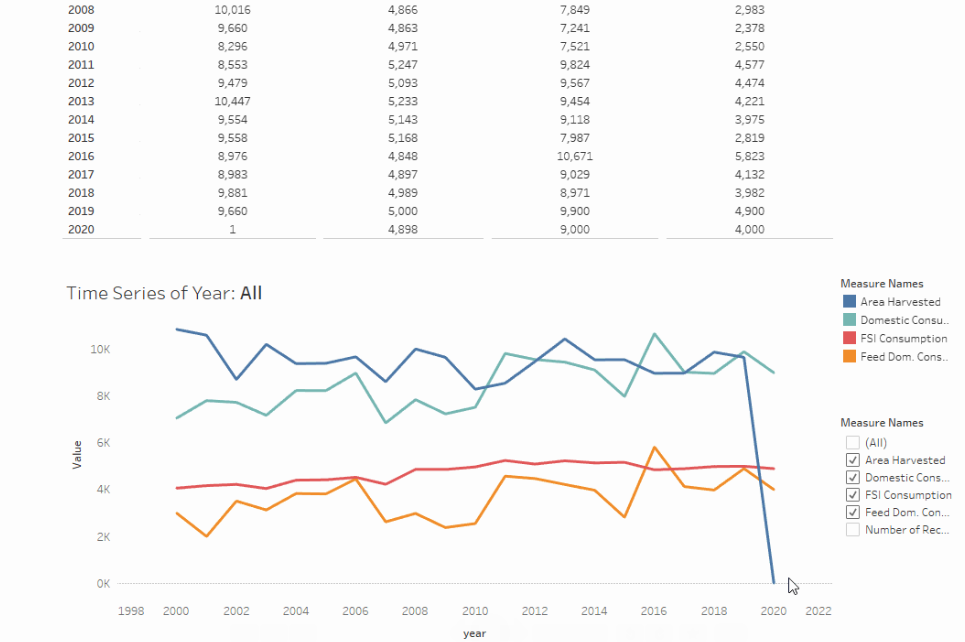
The objective of this project is to develop a dynamic dashboard in Tableau which can update the data source. The dataset for this visualization includes wheat consumption (domestic, fsi, feed dom., etc) in Canada over 20 years timeline.
XAMPP is used to host the data in a local server. The data is fetched from the local server into Tableau. The Tableau dashboard presents a crosstab and a line chart of the time series data.
read more
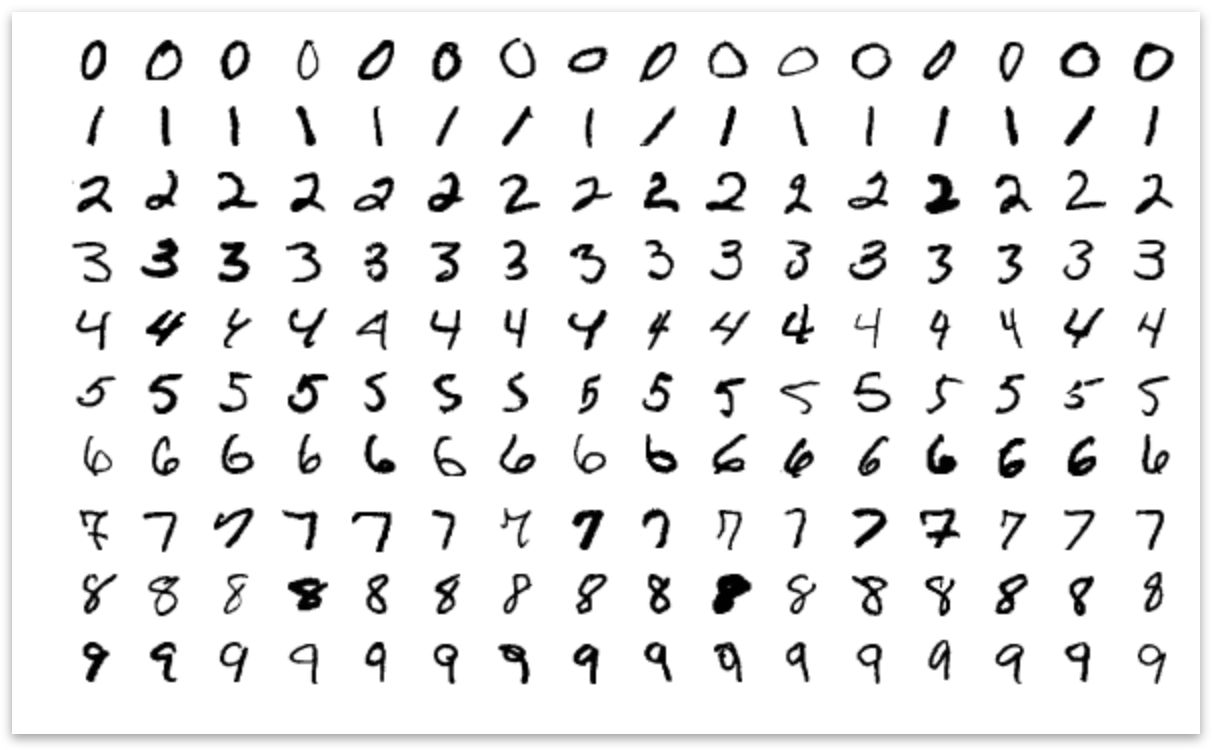
Handwritten Digits Classification - CNN
Classification of the handwritten digits (0-9) has been performed using CNN. The data set includes 60,000 training samples and 10,000 testing samples. The dataset is collected from MNIST.
Tensorflow 2.0 is used. The model includes 2 conv, 2 maxpool, 1 dense, 1 dropout layers. Earlystopping is performed. 99% accuracy is achieved. This Project’s GitHub Repository
read more
Rain Prediction - ANN
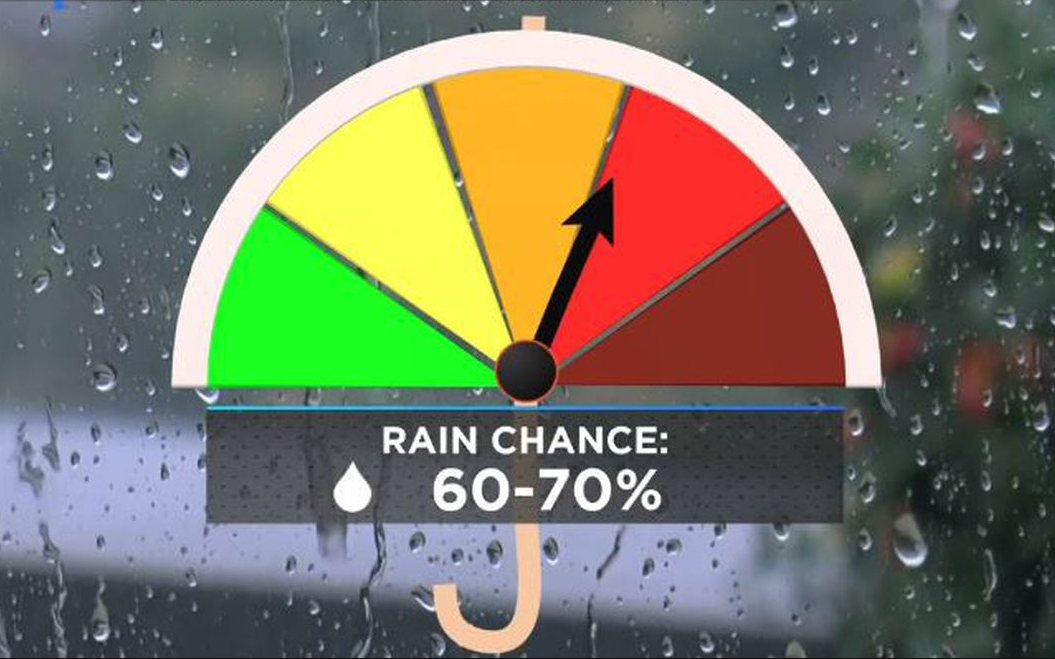
The purpose of this project is to predict if it will rain tomorrow. The data includes weather information (i.e., temperature, evaporation, wind speed, humidity, pressure and cloud status) of different locations in Australia. The data is quite imbalanced having a few instances of rain information. The objective is to train a neural network to predict rain tomorrow from the given information.
Pytorch is used for training. Feature selection is performed using Pearson’s correlation.
read more
Customer Churn Detection - Spark, MLib
The dataset includes different information about customers. The objective is to predict customer churn from the data. The input data is highly imbalanced consisting 150 churn (i.e., churn = 1) and 750 no churn (i.e., churn = 0) customers. Check the customer_churn.csv dataset for details.
MLlib and PySpark is used to build the model. Feature vectorization is performed to convert the categorical features. Random undersampling is performed to the majority class (i.
read more
Intent Detection - BERT
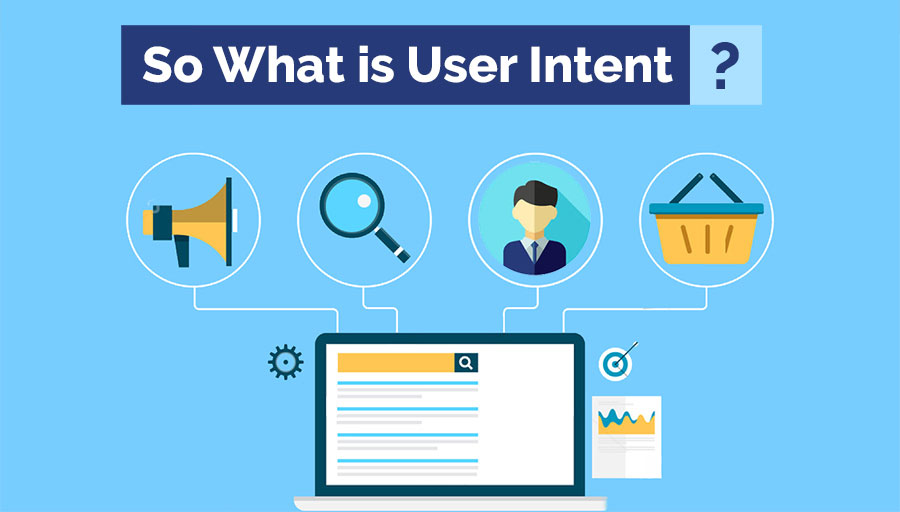
The objective of this project is to detect intent from texts. For this, a benchmark dataset is used, which includes 7 intents (Search Creative Work, get weather, Book Restaurant, Play Music, Add to Playlist, Rate Book, Search Screening Event) and 14 thousand samples. Transfer learning has been leveraged to train a machine learning model. The model takes the raw texts, which are tokenized and vectorized to feed into the pre-trained model.
read more
Spam Detection - Spark, MLib
The objective of this project is to detect spam messages. The dataset includes tagged SMS messages. It contains 5,574 English SMS messages in total; tagged as ham or spam. Check the SMSSpamCollection dataset for details.
MLlib with PySpark is used to build the model. Preprocessing steps are performed and feature engineering is applied using TF-IDF. Logistic regression, Random Forest and Naive Bayes are used for classifications. The best performance is achieved for the Logistic regression with 97% accuracy.
read more
House Price Prediction - Regression
The objecive of this project is to predict house price from different features. The dataset includes 1460 instances and 80 features. The following algorithms are applied as on selected features from the data:
Applied Algorithms: Linear Regression Decision Tree SVM Random Forest AdaBoost GradientBoost XGBoost Feature selection is performed using Parson Correlation. Feature imputation, encoding, and scaling is performed. The best performance achieved is R-square = 0.
read more
Eye Pointer: A system designed for amputees - Haar Cascade, OpenCV, C#
The objective of this project is to develop a system for physically impaired people who do not have a pair of working hands. The system provides different functionalities to the users: navigate computers using head movements, eye blink for clicking, different head gestures to read documents, and watch multimedia. The system is developed using C#. The head movement is tracked using EmguCV (OpenCV wrapper) and some heuristic calculations. Blink detection is performed using haarcascade of eyes.
read more
Blind Reader - A pdf reader designed for blinds - Android, Java
A pdf reader that allows a blind person to read documents. The concept is to use the haptic touch on the screen and speak aloud the word on tap. This system provides some smart features e.g., dynamic scrolling, line checking and vibration notification for the line break. The system is built on the Android platform. The smart feature - dynamic scrolling leverages the phone gyroscope reading and can detect tilt. Based on the tilt angle it triggers the scrolling.
read more
eExpense: A smart approach to track everyday expenses - Android, Java, Tesseract-OCR
eExpense is a smart system that keeps track of everyday expenses. Some of the key functionalities of this app are automatically detecting expenses from text messages, automatically taking input from the receipts, creating a balance sheet, showing history in the calendar view. The system is built on the Android platform. The input from receipts is taken using Tesseract OCR (Optical Character Recognition) engine. Publication Source: Check the publication
read more
Hand Swifter: Control computer with hand gestures - Haar Cascade, OpenCV, C#
A system to replace the traditional mouse and keyboard that only uses hand gestures to control computers. This system focuses on navigating computers, reading documents and controlling multimedia like videos, pictures. This multimodal system uses a leap motion device and a webcam to capture hand movements and different gestures.
Real-time tracking of hand movement. (haarcascade, Viola-Jones) Implements the Kalman filter for smoothing. Captures hand gesture with leap motion device.
read more
Pointer Security: A security system for computers - C#
A security system for computers which runs as the background process and tracks keyboard or mouse inputs. Any unauthorized input triggers this system and sends a notification to the user’s phone through text messages (GSM). Users can use a mobile app (named Pointer Security) to see the live webcam feed, screen streaming and check who is using the computer and can send commands remotely through the app to either shut down or lock the computer.
read more
