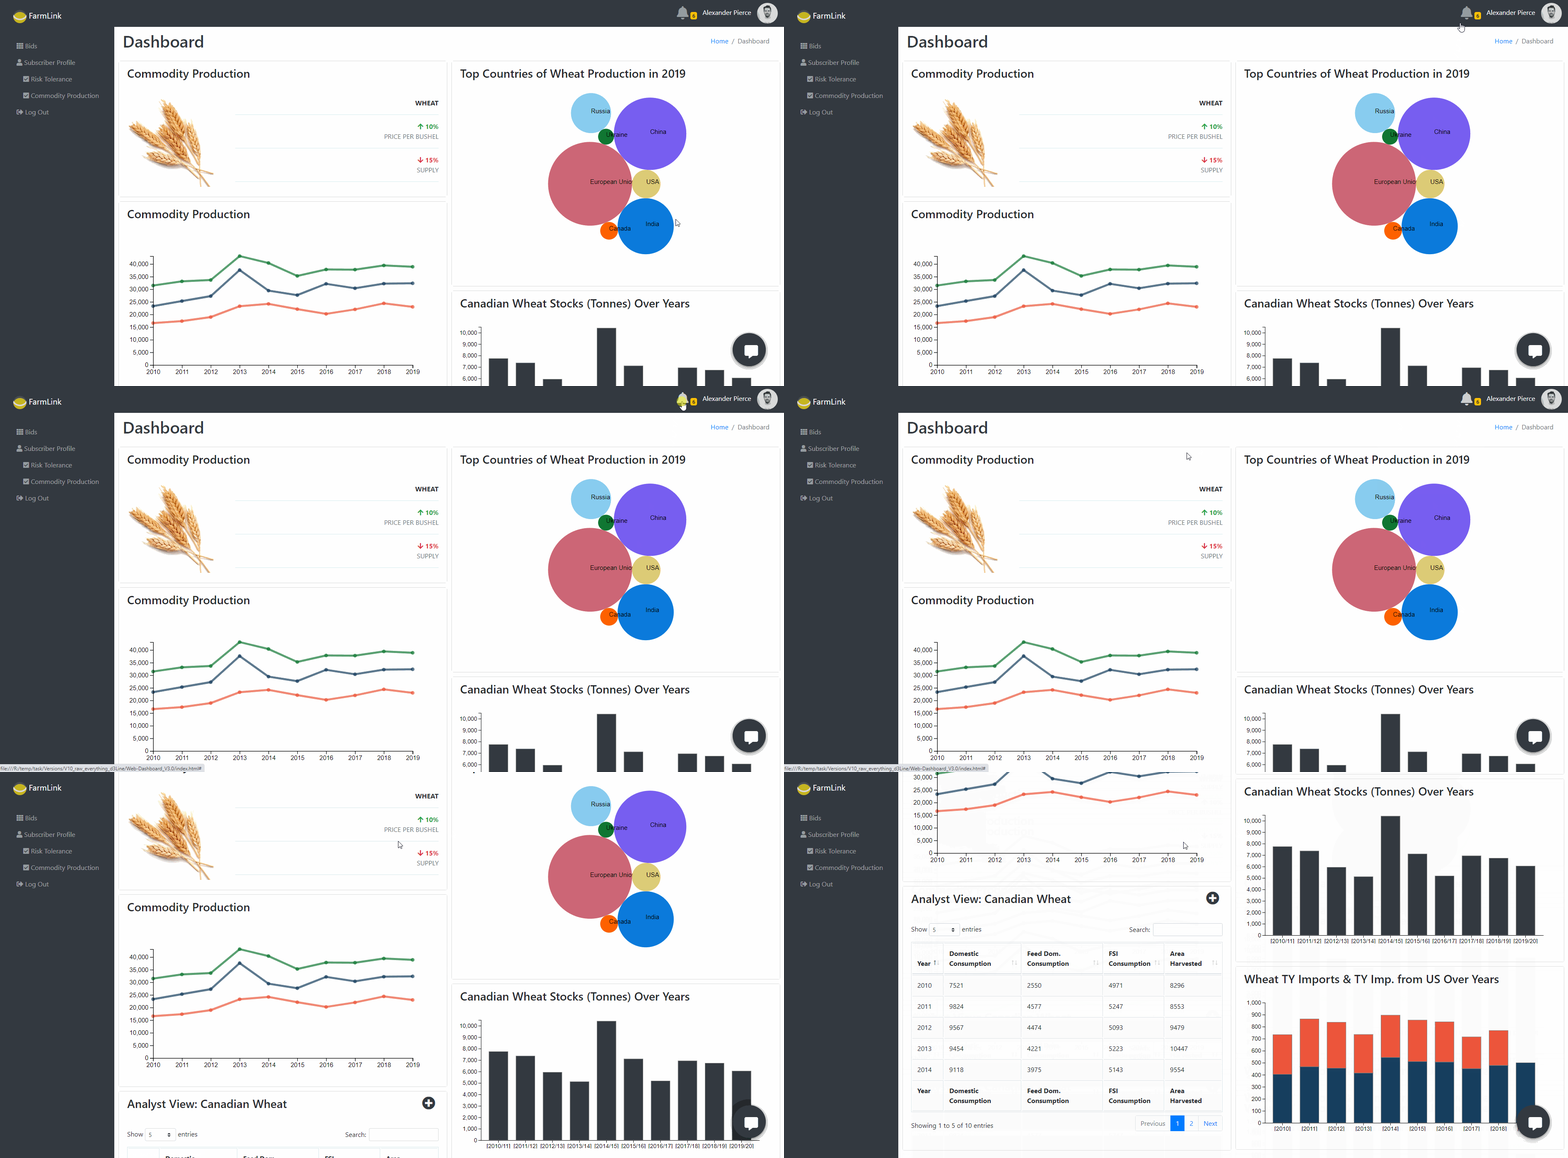
Web Dashboard on Canadian Wheat Production - Tableau, D3 js, Chart js, Angular js

The purpose of this project is to gain insights into the agricultural market data of different commodities, e.g., Wheat, Corn, Barley, Oats etc. and present them in a dashboard. The data includes different attributes such as consumption, production, import, export, stocks, yield of the commodities. The data reports attributes on 125 countries and over 20 years timeline.
- The UI supports responsive layouts.
- For developing the visualizations, PSD Grain Data_small.xlsx has been used.
- For keeping the project simple, only “Wheat” from country “Canada” has been used for the calculations of the timeseries, barplot, crosstab, and pack layout graphs.
- The visualizations have been developed using D3.js and Chart.js.
- The color palettes of the visualizations are carefully chosen to support color-blind users.
- The calculations have been performed using Tableau.
This Project’s GitHub Repository